Economy
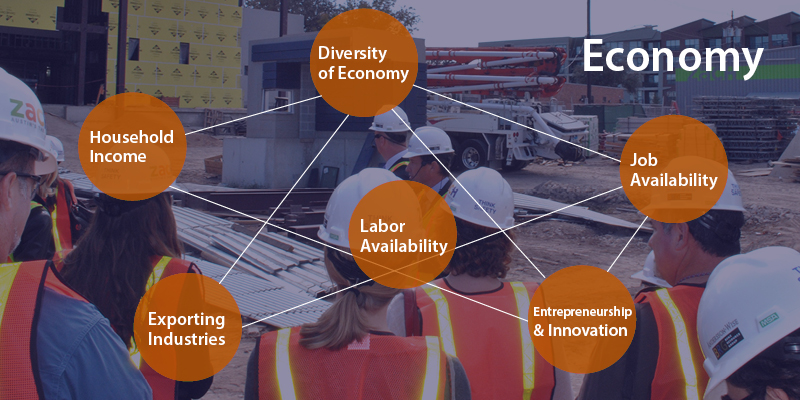
Sustainability efforts can flourish if economic prosperity is distributed across sectors and demographic categories of a region. More than ever before, communities are actively involved in critically examining how their local economies work and how to plan for their economic future. Economic indicators provide an important signal to guide this effort. Key economic indicators include: income, diversity of the economy, labor, exports, and entrepreneurship. In general, the Austin area has seen strong economic growth with an increasing median income in the years since the 2008 recession. Unemployment rates have decreased while exports and entrepreneurial activity have increased. However, a growing proportion of the labor seems to be employed by a small number of large capital companies and racial disparities persist with regard to economic well-being.
Key Indicators
Income
The Austin Area economy remains robust, which is raising median family income across the board. The most recent estimates from the FFIEC are $86,400, a 12.5% increase from 2015. The most recent 5-year estimates from the American Community Survey also found that 56.7% report household income above $60,000, a 7% increase from 2010.
Median Home Prices
As one of the fastest growing metropolitan areas in the nation, the median home price in the Austin area reached an all-time high of $305,070 in 2018, 113% higher than the price in 2000. Median home price surpassed the median family income for the region in 2006.
Un-employment Rates
Travis and Williamson counties show broader decreasing patterns of unemployment. By contrast, Bastrop and Burnet unemployment rates are persistent or growing. Disparities in unemployment across race/ethnicity categories continue to exist.
Training for Better Jobs
The perception of the availability for quality education, professional development or training for jobs has remained roughly the same between 2008 and 2018, although a higher percentage of people (57%) view this kind of training as “usually available,” rather than “very available” than in past years. A higher percentage of black (26%) and Hispanic (19%) residents don’t believe the kind of training for the kind of job they’d like to have is available, as compared to other race/ethnicity categories.
Self-employment and Entrepreneurship
The number of utility patents and the volume of venture capital investments continue an upward trajectory since the 2009 recession. In 2015, the entrepreneurial spirit persists with increasing numbers of households reporting self-employment income. Over 14% of households report self employment income; this is higher than Houston MSA (12%) and Dallas MSA (11.3%).
Thinking about the economic section, some questions to consider:
- How does population distribution across the region affect employment opportunities for particular groups of people? Where are large businesses located relative to those unemployed?
- Employees of which industries are most likely to lack health coverage?
- Do we have the resources to train people to take advantage of the job opportunities in the area?